Swift
Smoothing noisy weight data with an EWMA trend in SwiftUI
A bathroom scale will happily move a full pound overnight while nothing about your body has meaningfully changed, so the weight tracker I just finished refuses to celebrate or punish any single reading. This is the trend engine that actually ships in it, from a formula written for pen and paper to the caching layer that keeps chart scrubbing smooth on a ProMotion display.
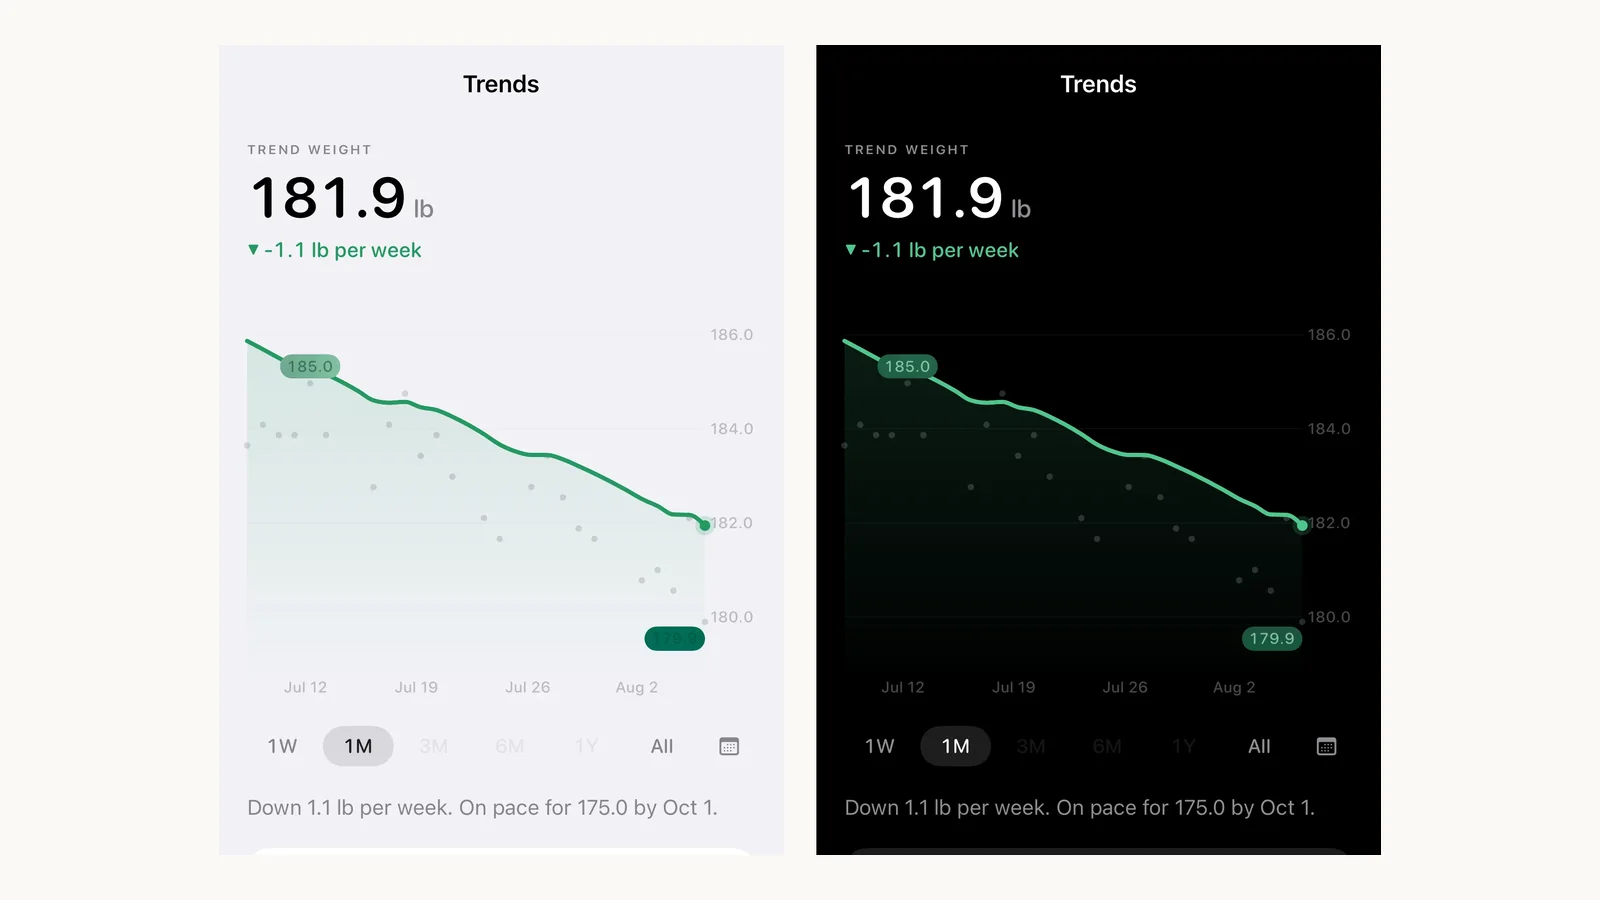
Scale weight is a noisy signal
Day to day scale weight is dominated by water, glycogen, and the timing of meals. Those three swing the number by one to three pounds, while genuine change creeps along at something closer to a tenth of a pound per day. The signal is real, it's just buried under an order of magnitude more noise, which is why looking at this morning's number and drawing a conclusion is worse than useless.
John Walker, who founded Autodesk, made that observation the foundation of The Hacker's Diet in the early 1990s, treating body weight as a signal processing problem in which each daily reading is a noisy sample of a slow moving underlying value. Most serious trackers built since run some version of his idea, and this one is no exception.
One line of arithmetic per day
The method Walker chose is an exponentially weighted moving average,
which sounds imposing right up until you notice that the whole
algorithm is a single line of arithmetic applied once per calendar
day. The engine is a pure value type called TrendEngine,
and the line in question sits in the middle of its
series function.
/// The Hacker's Diet exponentially weighted moving average, P = 0.10,
/// with linear interpolation across missing days before smoothing.
/// All math is in kilograms; display conversion happens elsewhere.
nonisolated enum TrendEngine {
    static let smoothing = 0.10

    static func series(entries: [DayWeight], calendar: Calendar = .current) -> [TrendPoint] {
        // Dedupe by calendar day (last wins), then sort ascending.
        var byDay: [Date: Double] = [:]
        for e in entries {
            byDay[calendar.startOfDay(for: e.day)] = e.kg
        }
        // ... walk the calendar day by day ...
        if let t = trend {
            trend = t + smoothing * (value - t)
        } else {
            trend = value
        }
    }
}
Each day's trend is yesterday's trend pulled ten percent of the way
toward today's reading. A two pound water swing therefore moves the
line by two tenths of a pound, while a genuine tenth of a pound per
day accumulates into a slope you can see. The constant sits in the
engine as
smoothing = 0.10, which is the value the book recommends
and the one the long standing trackers in this category settled on
decades ago.
What a smoothing constant of 0.10 actually buys
It's worth being precise about the cost, because the marketing version of exponential smoothing tends to imply you get stability for free. You don't. Working the geometric series out gives numbers that are easy to state and worth knowing before you pick a constant.
With a factor of 0.10, a reading contributes ten percent of its value on the day you take it, nine percent the next day, and just under five percent a week later. The most recent seven days together supply about half the current trend, and a reading from a month ago is still in there at four tenths of a percent. The mean age of the data behind today's number works out at nine days, and the smoothing is about as heavy as a nineteen day simple average.
So the line lags, and it lags by more than a week. That's the tradeoff, and it is the right one here: a number people check every morning needs to be stable enough that a heavy dinner doesn't read as failure, and nine days of lag is a reasonable price for never having to say "ignore today". The alternatives fail in ways that are harder to live with.
| Method | What it costs | Why I did not ship it |
|---|---|---|
| Seven day simple average | Three days of lag, and a week of warm up | Steps visibly whenever an outlier falls out of the window |
| Double exponential smoothing | Tracks level and slope separately | Extrapolates the current rate, so it overshoots when the rate changes |
| EWMA at 0.10 | Nine days of lag | Shipped. The lag is deliberate |
The seven day average is genuinely more responsive, which is the one thing people assume exponential smoothing wins on. What it can't do is behave gracefully at the edges. It says nothing until a week of data exists, and every time an unusual reading leaves the back of the window the average jumps by a visible amount for no reason the user can perceive. The EWMA has no window to fall out of, initialises from the very first entry, and carries its entire history in one number.
Missing days get interpolated, never invented
Real logs have holes in them, because people travel and forget. A naive implementation that feeds Monday's entry straight in after the previous Tuesday's would let one reading yank the trend as though six days of change had arrived at once. Before any smoothing happens, the engine walks the calendar a day at a time and linearly interpolates a value for every missing date between two real entries.
// Linear interpolation between the surrounding real entries.
let prevDay = days[nextEntryIndex - 1]
let nextDay = days[nextEntryIndex]
let span = daysBetween(prevDay, nextDay, calendar: calendar)
let offset = daysBetween(prevDay, day, calendar: calendar)
let fraction = Double(offset) / Double(span)
value = byDay[prevDay]! + (byDay[nextDay]! - byDay[prevDay]!) * fraction
Interpolated days carry a nil scaleKg in the resulting
TrendPoint, which the chart reads as an instruction to
draw nothing at that date. The invented values feed the arithmetic and
never appear as dots, so nobody can mistake them for a weigh-in they
didn't take.
The trend is computed on demand and never persisted. Entries live in
a single SwiftData model keyed by startOfDay, one row
per calendar day with the last write winning, and everything derived
comes out of the pure engine at read time. A future change to the
smoothing constant would then recompute all of history consistently,
instead of gluing two algorithms together at a migration boundary.
The headline number is the trend, not today
Given all of that, the number at the top of the screen is the trend value rather than the most recent weigh-in, and the label says so. Showing today's reading in large type would undo the entire point of computing a trend, because that's the figure people react to.
The rate underneath it carries the same intent. It reads as pounds per week derived from the trend line rather than from the first and last readings in the range, which would be a difference of two noisy samples and would swing wildly depending on which days those happened to be.
Direction without relying on colour
A green number going down and a red number going up is the obvious design, and on its own it fails for anyone who can't separate those two hues. So the direction is stated three times over: a triangle pointing down, an explicitly signed number, and the word spelled out in the stat card below.
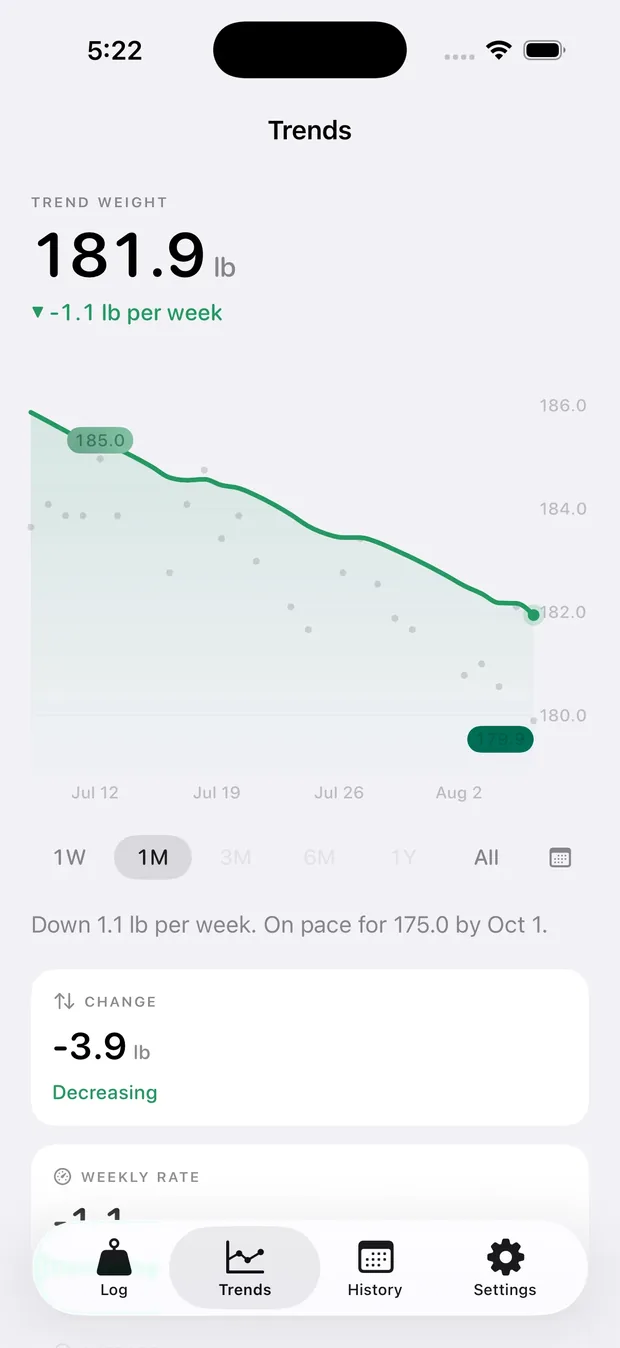
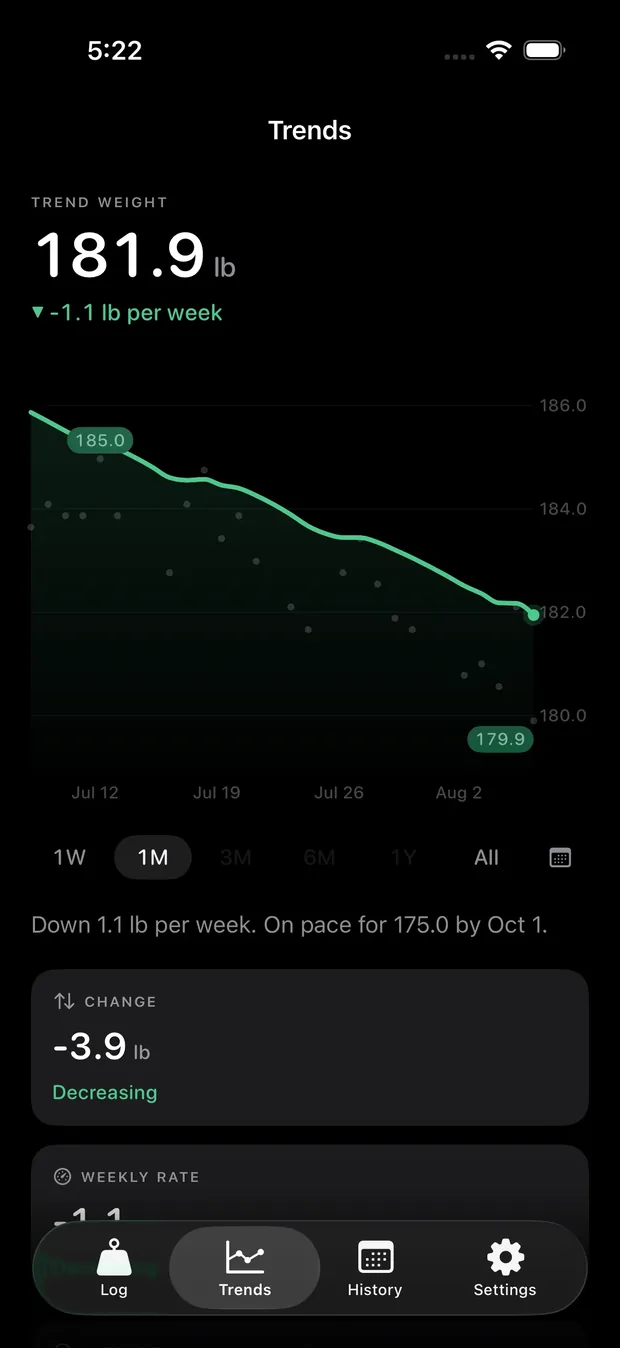
Turn the colour off entirely and the screen still tells you the weight is falling. That's the actual requirement behind Apple's Differentiate Without Colour setting, and it's cheap to satisfy if you decide on it early rather than retrofitting it after every view already leans on a tint.
The scrub that recomputed everything
The first build of this screen stuttered the moment a finger touched the chart on a real device, and the cause was embarrassing in the specific way performance bugs usually are. Selection state changed on every frame, every change re-evaluated the SwiftUI body, and the body reached its data through computed properties that each re-ran the entire engine. A single scrub frame could recompute the whole trend several times over, at up to 120 frames per second.
/// Everything derived from the entries, computed once per data/range
/// change and NEVER during scrubbing. Scrub frames only do O(1) lookups.
private struct ChartBundle: Equatable {
    var series: [TrendPoint] = []
    var visible: [TrendPoint] = []
    var visibleByDay: [Date: TrendPoint] = [:]
    // stats, weekly rate, thinned draw arrays, y domain ...
}

@State private var bundle = ChartBundle()

// Rebuilt only when the data fingerprint, range, zoom, or unit changes.
.task(id: bundleKey) { rebuildBundle() }

private var selectedPoint: TrendPoint? {
    guard let selectedDate else { return nil }
    return bundle.visibleByDay[Calendar.current.startOfDay(for: selectedDate)]
}
Everything derived from the data now lives in a
ChartBundle held in state, rebuilt by a task keyed on a
cheap Hasher fingerprint of the entries combined with the
selected range. A scrub frame resolves the touched day with one
dictionary lookup and touches nothing else, and the jitter disappeared
completely.
The other half of the lesson cost nothing but pride. I had been judging animation feel on Debug builds, where an unoptimised SwiftUI binary stutters in ways a Release build simply does not, so the repository now carries a standing rule that feel is only ever assessed on device in Release.
Long histories get thinned before drawing for the same reason. A five year log holds close to two thousand points whose marks would fight over the same pixels, so a helper caps the drawn line at roughly 380 points and the dots at 420, while the statistics and the scrubbing always consult the full resolution series.
Pinning the numbers, not the shapes
Because the engine is a nonisolated enum with no
dependencies, it's boring to test in the best possible way, and the
suite pins exact numbers rather than loose shapes. Feeding it 100, 101
and 102 has to produce trends of exactly 100, 100.1 and 100.29, which
is the same arithmetic the book prints, and a separate test proves
that a two day gap interpolates to identical trend values while still
marking the middle day as having no real entry.
My favourite test in there exists because of somebody else's bug.
Apple's own Health app has a long standing problem with stones, where
a decimal entry is treated as a fraction of a stone rather than as
pounds, so a value like 13.12 becomes thirteen stone plus twelve
percent of a stone. The visible symptom is that
weights sort into the wrong order, which is a failure class that only appears when display units leak
into comparisons. Ounce sidesteps the whole category by storing
canonical kilograms and converting to pounds or stones at the last
possible moment, and stonesOrderingIsCorrect asserts that
it stays that way.
Forty one tests cover the engine, the unit conversions, the goal state machine and the projection, and the whole suite runs in about a second. None of them touch a view, which is the reason they're worth having.
What it costs
Shipping a smoothed trend instead of a raw line costs one small enum, a day of chart tuning, and a caching layer you would eventually need anyway. What it buys is the only honest view of a number this noisy, at the price of telling people about a change roughly nine days after it starts. For a measurement where the noise is ten times the daily signal, that's a trade I would make again.
The app is a fully local iOS tracker with no account, no analytics, and entries stored nowhere but the device. More of what I build is on my projects page, and if you want the same idea applied to inference rather than signal processing, the background removal post covers running a model with no server behind it.